
Table of contents
Header Photo by Matthew Ansley on Unsplash
OpenTelemetry
OpenTelemetry(OTEL)は、CNCFのプロジェクトの1つです。Observabilityの重要性が語られ始めて久しい昨今ですが、OTELはクラウドネイティブなソフトウェアにおいてObsevabilityを実現するためのAPI、SDK、ツール群です。GitHubにたくさんの関連リポジトリがあります。
メトリクス、ログ、トレースを合わせてテレメトリデータと呼んでいます。OpenTelemetryを使ソフトウェアを計装し、テレメトリの生成、収集、エクスポートが行えます。オープンソースかつベンダー(vendor neutral)に依存しない点も特長です。
OpenTelemetry Collector
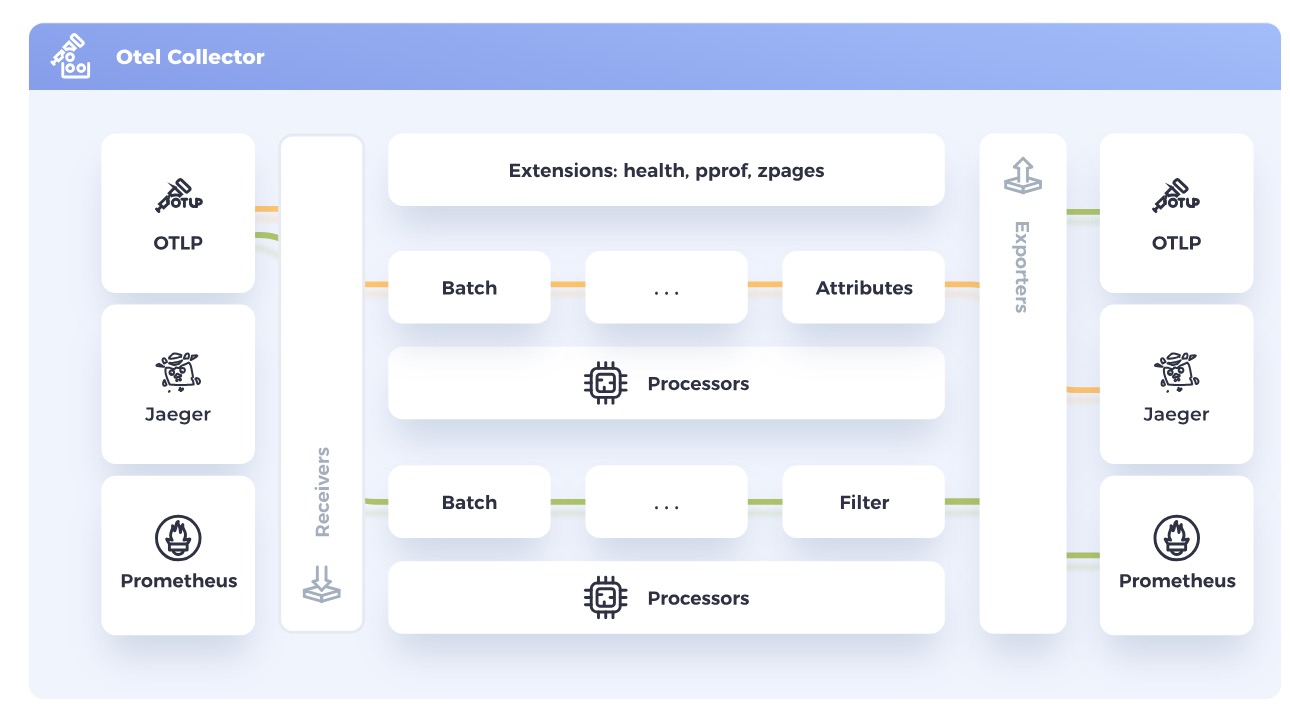
OpenTelemetry Collectorは、さまざまなテレメトリデータを受信、処理、エクスポートするためのコンポーネントです。以下の図のように、Jeager、Prometheusなどからテレメトリデータを受信し、処理した後、バックエンドにデータを送信できます。これにより複数のエージェント/コレクターを管理・運用する必要がなくなります。
Red Hat build of OpenTelemetry
UpstreamのOpenTelemetryプロジェクトに基づいた製品で、OpenShift上におけるOpenTelemetry Collector のデプロイと管理、さらにワークロードの計装の簡素化をサポートします。つまり、OTEL Collectorの導入や自動計装などを、OpenShiftクラスタおよびその上で動くワークロードに提供します。
OpenShiftでは、(OpenShiftらしく、)Operatorを使ってOpenTelemetry Collectorをデプロイします。具体的には、OperatorHubからRed Hat build of OpenTelemetry Operatorをインストールした後、OpenTelemetryCollector CRを作成します。OpenTelemetryCollector CRの spec.onfigには、主に以下の項目を設定します。
- Receiver: データを取り込む。OTLP Receiver、Jaeger Receiver、Prometheus Receiver (Tech Preview)などのプロトコルがある
- Processor: データが受信されてからエクスポートされるまでの間のデータ処理。Batch Processor、Memory Limiter processorなどがある
- Exporter: データを1つ以上のバックエンドや宛先に送信する。OTLP exporter、OTLP HTTP exporter、Debug exporter、Prometheus exporterなどのプロトコルがサポートされる
詳細は、ドキュメントを参照してください。
Red Hat build of OpenTelemetryで遊ぶ
Red Hat build of OpenTelemetryおよびOTELがなにもわからなかったので、Sidecar injectionを用いてOTEL Collectorをワークロードに挿入する方法を試してみました。サンプルアプリ(Go)とYAMLマニフェストたちは、こちらに置いておきます。今回使った環境は以下の通りです。
- OpenShift: v4.14.20
- OpenTelemetry Operator: v0.93.0-3
Red Hat build of OpenTelemetryのインストール
前述の通り、OperatorHubからRed Hat build of OpenTelemetry (OpenTelemetry Operator)をインストールします。ドキュメントに従って実行すればOKです。
$ oc version
Client Version: 4.12.10
Kustomize Version: v4.5.7
Server Version: 4.14.20
Kubernetes Version: v1.27.11+ec42b99

$ oc get csv | grep opentelemetry-operator
opentelemetry-operator.v0.93.0-3   Red Hat build of OpenTelemetry                   0.93.0-3   opentelemetry-operator.v0.93.0-2   Succeeded
サンプルワークロード用コンテナイメージ作成
今回テレメトリデータをCollectorに送信するため、コンテナイメージを作成します。こんな感じでGoでOTELライブラリを使い計装してみました。
| |
これを以下のようなDockerfileを使ってコンテナイメージをビルドします。ビルドしたものは、ghcr.io/nishipy/go-otel-sample:latest にも置いてあります。
| |
サンプルワークロードのデプロイ
ビルドしたコンテナイメージを使って、ワークロードをデプロイし、Route を用いて公開してみましょう。まず、Deploymentを作成します。現時点では何の意味もないですがsidecar.opentelemetry.io/inject: "true" というアノテーションがポイントです。次節で作成する OpenTelemetryCollector CRによって追加されるAdmission Webhookがこのアノテーションを検知し、OTEL Collectorコンテナを挿入してくれます。
| |
作成したPodはRouteで公開します。
| |
これらのYAMLマニフェストを適用すると、以下のようにPodやRouteが作成されるはずです。
$ oc get pod
NAME                                     READY   STATUS    RESTARTS   AGE
otel-sample-deployment-b8696df8d-7xkll   1/1     Running   0          39s
$ oc get route
NAME                HOST/PORT                                           PATH   SERVICES              PORT   TERMINATION   WILDCARD
otel-sample-route   otel-sample-route-otel-sample.apps.test.lab.local          otel-sample-service   8080                 None
$ curl -I otel-sample-route-otel-sample.apps.test.lab.local
HTTP/1.1 200 OK
date: Mon, 06 May 2024 14:34:48 GMT
content-length: 14
content-type: text/plain; charset=utf-8
set-cookie: 27c7a5203dbedf674a50081de44f4d21=f3ceec06cdf162006c6cd294f3279af3; path=/; HttpOnly
OpenTelemetry Collector の設定
ドキュメントに従って、OpenTelemetry Collectorをサイドカーコンテナとして挿入しましょう。まず前段として、OTEL Collectorサイドカーコンテナのために必要なServiceAccountおよびClusterRole、ClusterRoleBindingを作成します。
| |
次に、OpenTelemetryCollector CRを作成します。Export先にTempoのインスタンスを用意するのは骨が折れそうなので、今回は以下のようにします。(ちなみにドキュメントの設定をコピペしても、service.pipelines の設定が間違っていたり、serviceAccountを指定するインデントが間違っていたりして、エラーになると思うのでご注意ください)
| |
spec.mode: sidecar を設定することにより、OTEL Collectorサイドカーコンテナを、sidecar.opentelemetry.io/inject: "true" アノテーションを持つPodに挿入します。
Receiverとしては、OTLP Receiverを使っています。これはGoで書いたサンプルコード内で、OTLPプロトコル(over gRPC)を使ってトレースを生成しているためです。また、Exporterには、Debug Exporterを使います。その名の通り、デバッグ用にテレメトリデータを標準出力にエクスポートします。
YAMLマニフェストを適用すると、以下のように mutating webhook が見えるはずです。
$ oc get mutatingwebhookconfigurations.admissionregistration.k8s.io -l olm.owner.namespace=openshift-opentelemetry-operator
NAME                                  WEBHOOKS   AGE
minstrumentation.kb.io-ddjq4          1          20d
mopampbridge.kb.io-5hkkl              1          20d
mopentelemetrycollector.kb.io-4bfwl   1          20d
mpod.kb.io-7dmnz                      1          20d
OpenTelemetry Collector sidecar の挿入
mutating webhook も用意できたので、実験用にデプロイしていたPodを再作成しましょう。Admission Webhookにより、OpenTelemetry Collectorがサイドカーコンテナとして追加されるはずです。Podを一旦削除すると再作成され、READY列が 2/2 になり、サイドカーコンテナが挿入されたことがわかります。準備完了です。
$ oc get pod
NAME                                     READY   STATUS    RESTARTS   AGE
otel-sample-deployment-b8696df8d-7xkll   1/1     Running   0          8m31s
$ oc delete pod otel-sample-deployment-b8696df8d-7xkll
pod "otel-sample-deployment-b8696df8d-7xkll" deleted
$ oc get pod
NAME                                     READY   STATUS    RESTARTS   AGE
otel-sample-deployment-b8696df8d-gc6hg   2/2     Running   0          37s
試しにRoute経由でPodにcurlでアクセスした後、OpenTelemetry Collectorのサイドカーコンテナ(otc-container)を覗いてみると、テレメトリデータが表示されているのがわかります。
$ curl -I otel-sample-route-otel-sample.apps.test.lab.local
$ oc logs otel-sample-deployment-b8696df8d-gc6hg otc-container
2024-05-06T14:45:02.667Z        info    TracesExporter  {"kind": "exporter", "data_type": "traces", "name": "debug", "resource spans": 1, "spans": 1}
2024-05-06T14:45:02.667Z        info    ResourceSpans #0
Resource SchemaURL: https://opentelemetry.io/schemas/1.24.0
Resource attributes:
     -> service.name: Str(unknown_service:otel-sample)
     -> telemetry.sdk.language: Str(go)
     -> telemetry.sdk.name: Str(opentelemetry)
     -> telemetry.sdk.version: Str(1.26.0)
ScopeSpans #0
ScopeSpans SchemaURL:
InstrumentationScope http-server
Span #0
    Trace ID       : a1964374ea412edf92ee5d4f843071ab
    Parent ID      :
    ID             : 8fbada7e64abb4bf
    Name           : handleRequest
    Kind           : Internal
    Start time     : 2024-05-06 14:45:01.285150513 +0000 UTC
    End time       : 2024-05-06 14:45:01.385644776 +0000 UTC
    Status code    : Ok
    Status message :
        {"kind": "exporter", "data_type": "traces", "name": "debug"}
...